
PETROCHINA – Market cap: $194.23 Billion USD
Friends, I hope that the way I am creating a blog for you. You are seeing my blog and you are understanding what I am trying to tell you in it. I simply want to take your analysis to a very good level. I want that you people never need anyone to do the analysis. Now do a better analysis yourself and make a successful path for yourself.
So in today’s blog, we are going to discuss about Petrochina. Petrochina has a chart of how it can perform in the market. And friends, I am simply telling you one thing that whatever analysis I am bringing for you. I am bringing only a good company, a higher market cap company in all the analysis.
PETROCHINA Important Levels:

Because I know that this is important which you should understand. If you people understand how they are performing in the market in higher joints. And bigger joints, then you people can definitely do analysis about small players as well.
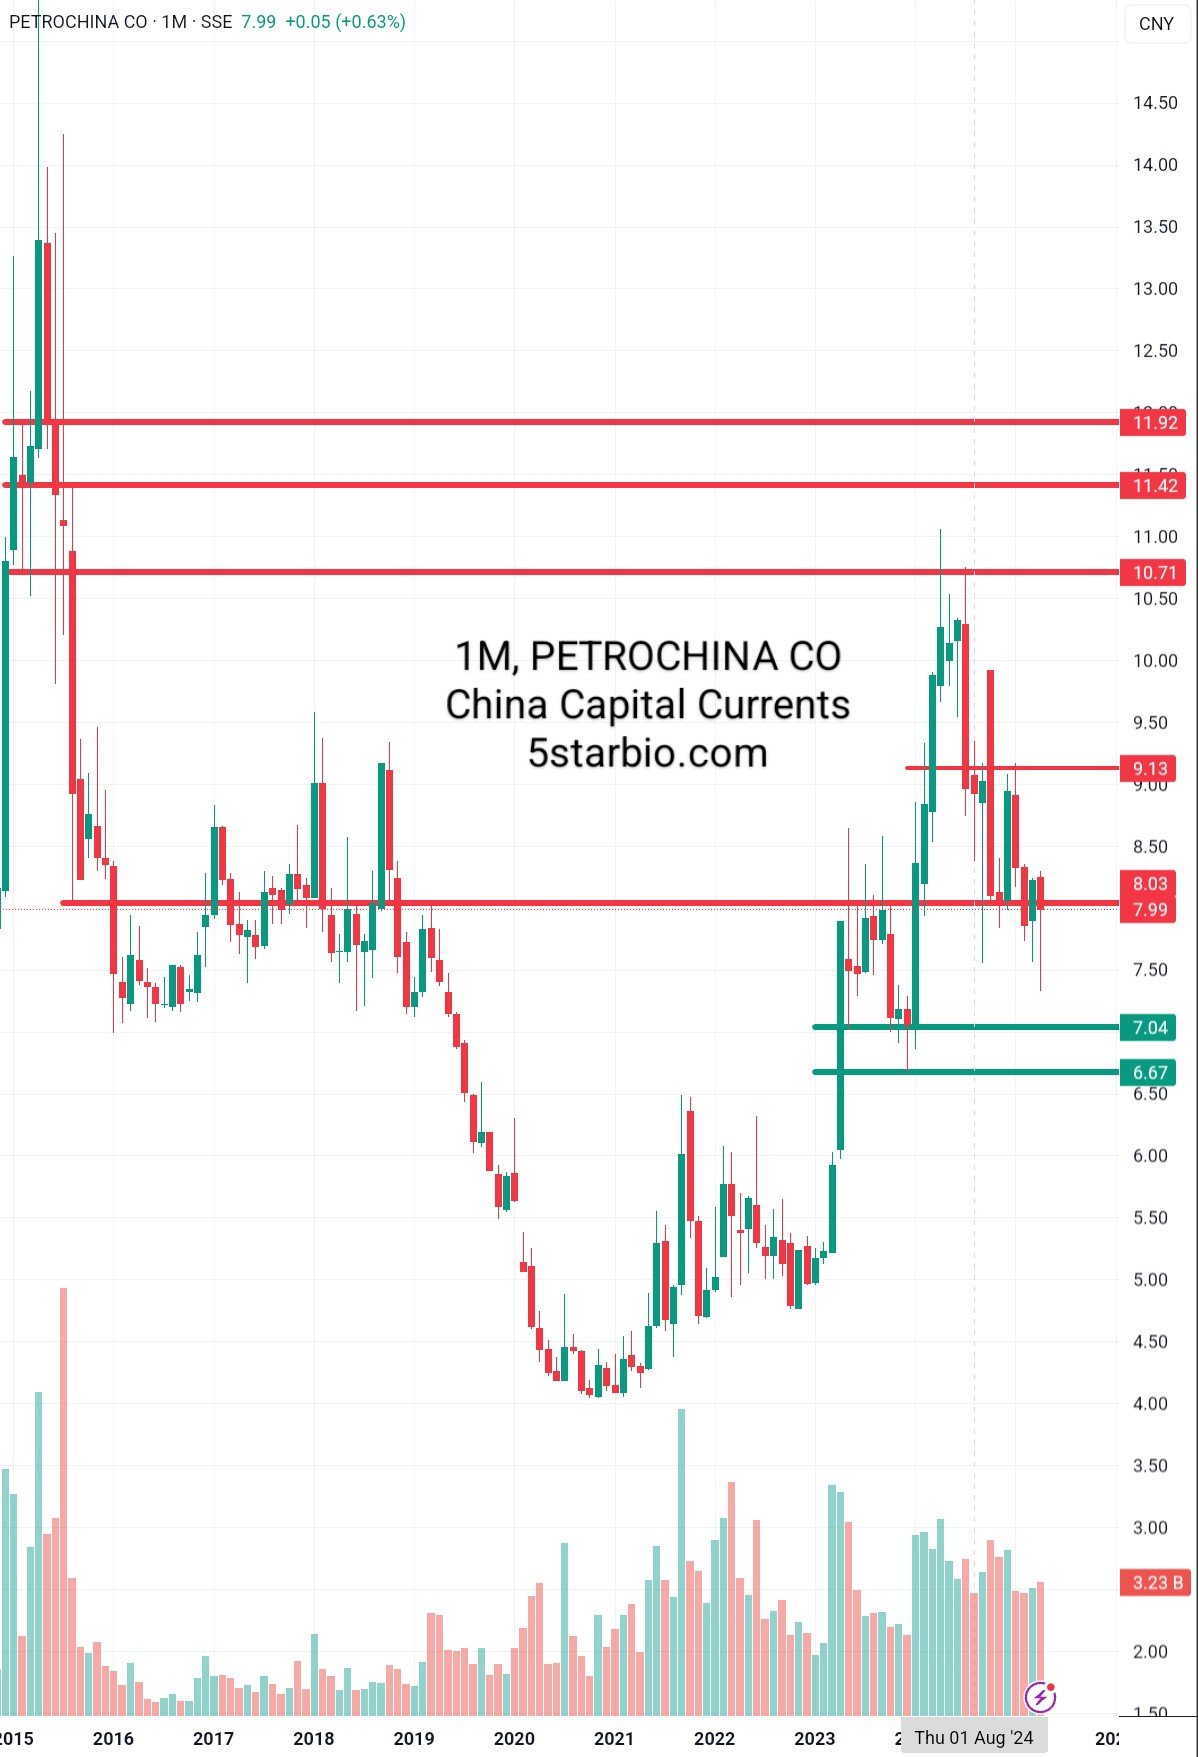
So we people understand which support and resistance can be found. Where demand and supply are in the market, which is very important for us. So if we see this, particularly if we see the chart of PETROCHINA. We will understand one thing that it was performing very well in the market. If you see, it had given a very good performance between 2014 and 2015.
But it fell below 10.7 in 2015 and when it fell down. Things became a bit difficult and since then it has taken time to recover. There are certain levels which were given a lot of respect in the market. Even today the market has not been able to cross those levels.
So first of all we should discuss which are those certain resistances where the market is still having a lot of difficulty in crossing. Your certain resistance is between 10.7, 11.5 and 11.92, this is from 10.7. Your range around 11.95. It is such a range where the market is facing a lot of difficulty in bringing an upside moment in the market.
Chart Factors in mind:
Now we understand what are the supports after these levels where the market tried to move forward very well. So there is a level where the market spends a long time for three-four years. It is around 8.0, it spent a long time near 8.0 and tried to move very well. But in 2019, after Covid, many things happened that that level was broken by the market. After that the market again respected those levels.
In 2023 and 2024, it created more new supports which were around 6.7 and around 7.0. From there the market went up and crossed 8.0 which was its important resistance, and gave movement to the market website and there.
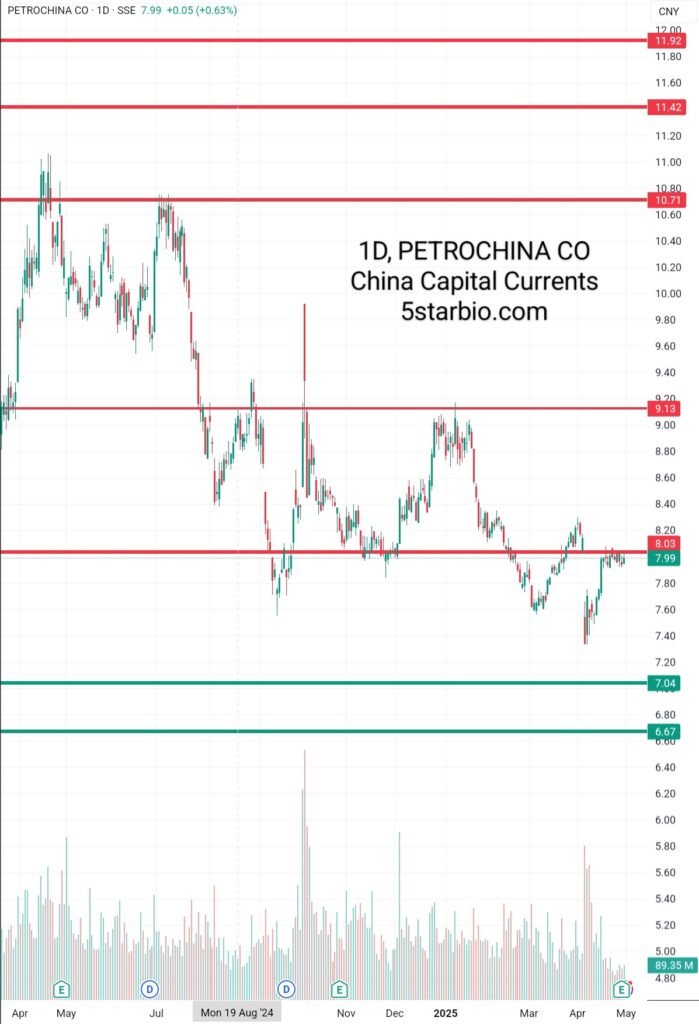
Try to give an upside movement and it will come back to 10.7, try to sustain it. It went up to 11 above it but the market could not sustain from there and today it has again come down and stopped around 8.0 and that is a very important support, so be very honest
In the market, you will see 6.67 which is a very important support, that too is the lowest important support, if the market stays above it. Then you can see the target of your upset which can be 9.13 first, secondly yours can be 10.7. Thirdly yours can be up to 12, which if the market settles now and its support is 6.67 only. If the market goes below it, then I think you should not work on it this month.
Keep watching, stay tuned, I will try to give my best, I will bring something new for you in every blog, thank you so much
You can also check the certain charts at: Bank of China
Our YouTube Channel link : Price Action Tourist